
Winnipeg Economic Digest (WED), Volume 2, Issue 3
Bottom Line
We appear to have turned a corner! While there continue to be tight labour markets in particular industries and occupations, the overall labour market is beginning to slacken in July 2023.
How did we get here?
The last few years have been a real roller coaster ride for labour markets. We saw the market initially take up slack when people returned to work after the early pandemic lockdowns and participation rates rose. Immigration had ground to a halt since very few could or would cross borders by air/land/sea for any reason. Thus, when so many employers were trying to hire at once, Canadian job vacancies soared to over a million requests. In 2022 we saw a returning surge of immigration and temporary foreign worker arrivals with the reopening of borders. Combined with post-secondary students (local and offshore) returning to university towns, this helped fill jobs that had been crying out for labour.
As this was happening, the pandemic accelerated changes in how people work. This is changing the nature of labour markets, rather than simply affecting the level of workers supplied or demanded by the market.
The share of workers engaged in hybrid or remote-only work has leveled off from its 2020 pandemic high but remains significantly elevated vs pre-pandemic shares. Recent Canadian estimates show that most hybrid/remote work is not cross-country or cross-border in nature, but rather restricted to employment with organizations located in a worker’s home province. While those working for employers in other provinces or abroad has risen, its share of all hybrid/remote work has remained relatively low.
It will take time for employers and workers to adapt to changes within the workplace. We will follow up on some indirect and induced economic activity in a future issue of the Economic Digest.
Analysis
It has been a while since we delved into the labour market, so we’re giving it a good hard look before we hit the back-to-school cycle in September. We look at estimates of the relative slack in labour supply and demand, and reasons for it. We also look at the state of hybrid/remote-only work since it appears to be leveling out at about six times the pre-pandemic level – hardly a flash in the pan.
Participation Rate
One element of labour supply slack is understanding the participation rate (PR). The PR is the number of people employed (E) or actively looking for work (U), expressed as a percentage of the population 15 years of age and over (P).
PR = [(E + U)/P]
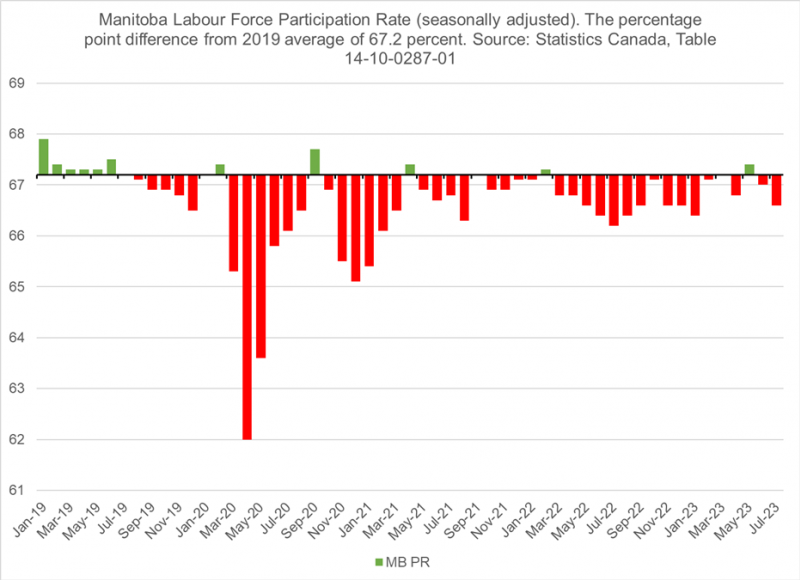
When we look at the deviation of Manitoba’s PR from the 2019 average PR of 67.2 per cent, we see that since late 2021, the PR has been less than a percentage point below the 2019 average. Thus, a low participation rate is not a relevant contributing factor to high job vacancy rates.
 As we headed into 2022, job vacancies soared as firms sought to replace workers laid off due
to the pandemic, particularly in industries such as restaurant, hospitality, retail,
and others. This rightfully had employers and governments concerned.
As we headed into 2022, job vacancies soared as firms sought to replace workers laid off due
to the pandemic, particularly in industries such as restaurant, hospitality, retail,
and others. This rightfully had employers and governments concerned.
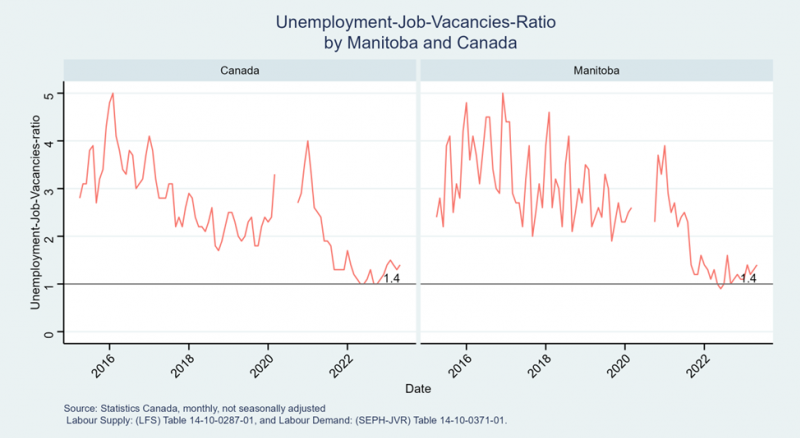
Now in July 2023, when we look at U and job vacancies (JV), we can see that while U is rising (supply), JV is falling (demand), indicating a slackening labour market. In Canada and Manitoba, the U/JV ratio is now 1.4. See the following chart.
If we compare July 2023 LFS seasonally adjusted stats, we see that the unemployment level rose by about 15.4 per cent Y/Y, far exceeding the increase in the working age population. The unemployment rate rose by 0.6 points Y/Y to 5.5 per cent, which indicates a slackening labour market.
Table 1: Year-over-year change in labour market statistics for Canada
| Description | Units of Measurement | July 23/22 change |
|---|---|---|
| Population | percentage change | 2.4 % |
| Labour force | percentage change | 2.8 % |
| Employment | percentage change | 2.2 % |
| unemployment | percentage change | 15.4 % |
| unemployment rate | change in points | 0.6 pts |
| participation rate | change in points | 0.3 pts |
| employment rate | change in points | -0.1 pts |
There continues to be issues in particular industries and occupations, but the overall market is cooling off.
Population Increases
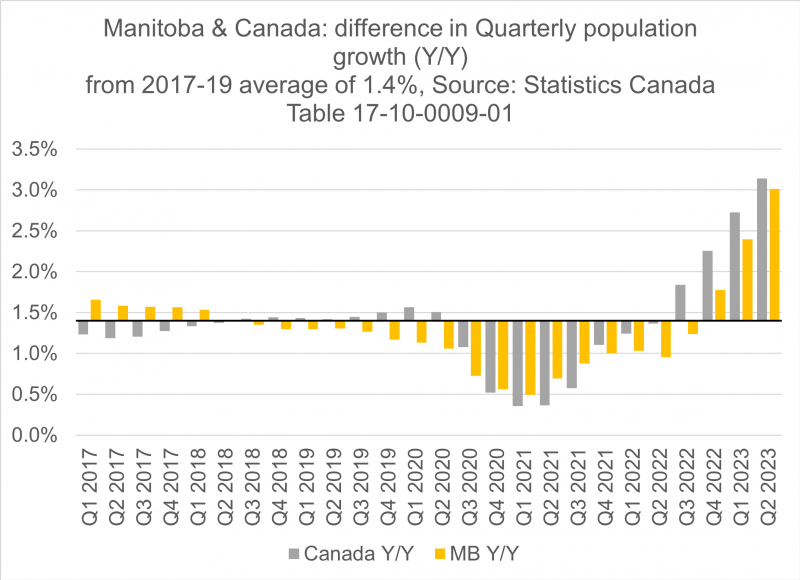
The key factor cooling off the labour market is the sharp recent increase in population.
During the pandemic, the growth of permanent residents, as well as arrivals of temporary foreign workers and offshore students, slowed. This was because airplane flights, and land border crossings were severely curtailed due to pandemic restrictions. These factors slowed our population growth and reduced our labour supply.
Since then, our population growth from all sources has surged. Both Manitoba and Canada’s latest quarter statistics are showing population up approximately three per cent in Q2 2023 from Q2 2022.
The above analysis deals with what is going on with supply and demand for workers, without considering a factor that is changing the nature of the workplace, namely hybrid/remote work, which saw mass adoption during the early stages of the pandemic.
How is hybrid/remote work affecting the labour market?
Hybrid/remote work has been slowly rising as a share of all employees for decades, but the pandemic saw a sharp increase in hybrid/remote work. The share of workers who perform some form of hybrid or even fully remote work, remains much higher than pre-pandemic.
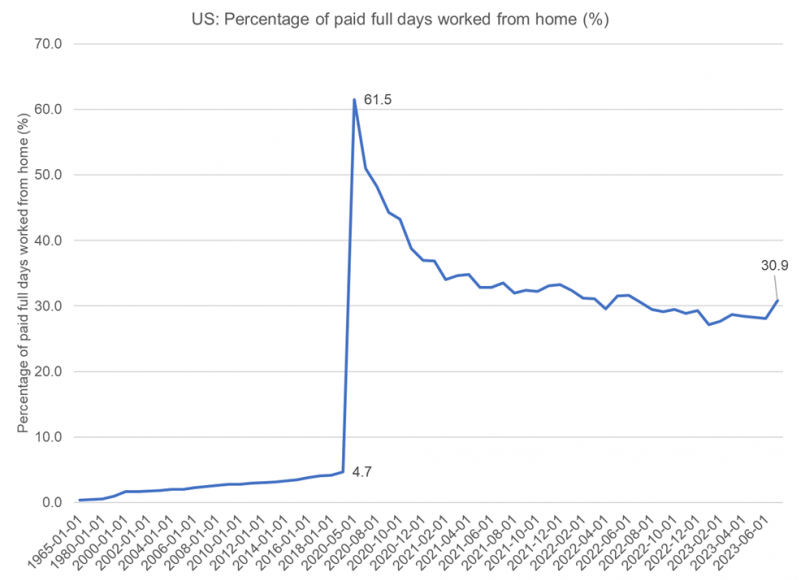
(Barrero, Bloom, & Davis, 2021) and subsequent work being maintained on the website WFR Research show this sharp increase and easing to a higher share of the workforce working either some form of hybrid or fully remote. The chart below shows historical U.S. data that peaked at 4.7 per cent before the pandemic in January 2019. The pandemic saw this surge to 61.5 per cent in May 2020. As of June 1, 2023, this has fallen to 30.9 per cent, still roughly six times higher than before the pandemic.
How does this look in Canada?
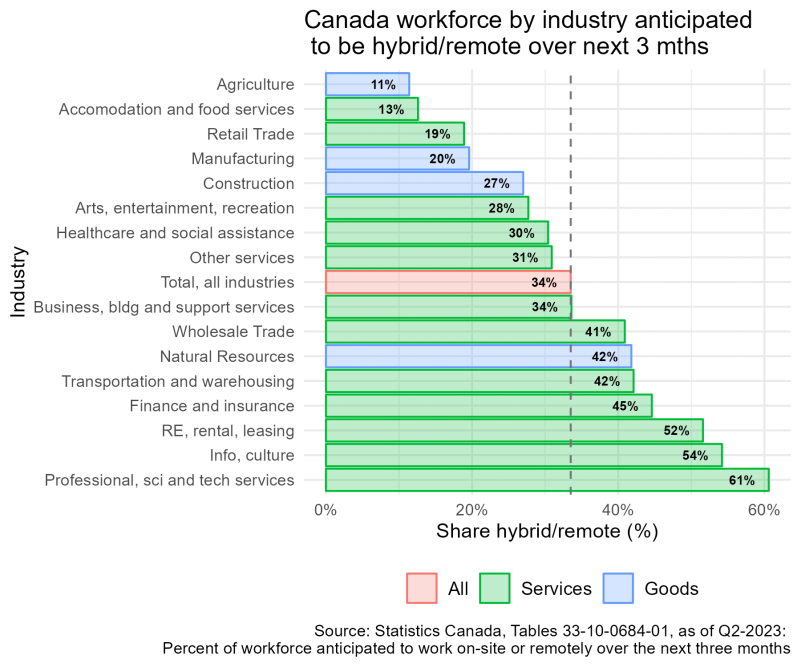
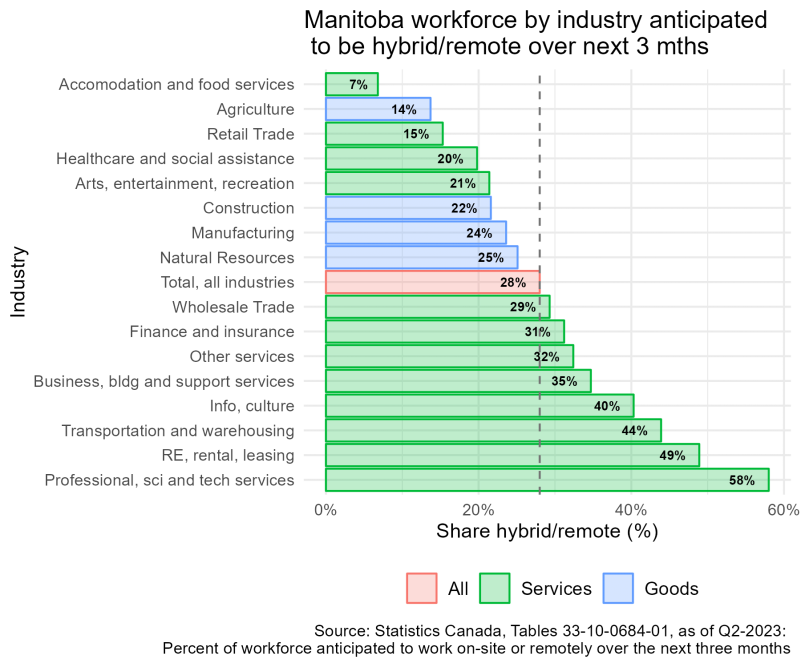
The Canadian Survey of Business Conditions (CSBC) for Q2-2023 study showed that employers are expecting elevated levels of some form of hybrid/remote work: Manitoba (28 per cent) and Canada (34 per cent). The charts below show that there is significant variance between industries and across geographies.
For Canada, most goods-producing industries are below the all-industries average of 34 per cent. The sole exception is natural resources, which is 42 per cent. Service industries claim the top four highest shares of hybrid/remote:
- professional, science and tech service (61 per cent),
- info, culture (54 per cent),
- real estate, rental and leasing (52%), and
- finance and insurance (45 per cent).
For Manitoba, all goods-producing industries are below the all-industries average of 28 per cent. Service industries claim the top four highest shares of hybrid/remote:
- professional, science and tech service (58 per cent),
- Real estate, rental, and leasing (49 per cent),
- Transportation and warehousing (44 per cent), and
- Info, culture (40%).
Interprovincial hybrid/remote work
Due to the rise in hybrid/remote work, there is some consideration of whether there is a rising share of local employees being hired by employers in other parts of the country or in other countries. This might tighten select labour markets locally, since workers would not be participating in their local labour market. [1]
Table 2: The distribution of fully remote workers (RM) by the geography of the employer
| Description | Canada | Manitoba | Source |
|---|---|---|---|
| RM Share - in another province, or abroad | 8.6 % | 12.7 % | 33-10-0685-01 |
| RM Share - in the same province | 91.4 % | 87.3 % | 33-10-0685-01 |
Share of workforce fully remote: | 6 % | 4.4 % | 33-10-0684-01 |
| - in another province, or abroad | 0.5 % | 0.6% | |
| - in the same province | 5.5 % | 3.8 % |
Using data from the Q2 2023 CSBC, table 33-10-0684-01, we see that approximately six per cent of Canada’s all-industries workforce is expected to be fully remote. For Manitoba, this figure is estimated to be 4.4 per cent. A follow up question for those working fully remote addresses whether the person is working remotely within their own province or interprovincially or abroad. [2]
For Canada, the share of those working fully remotely either interprovincially or abroad is approximately 8.6 per cent. For Manitoba, the share is estimated to be 12.7 per cent. When we translate this back to the overall workforce, approximately 0.5 per cent of Canada’s workforce would be working remotely for an employer located in another province (IP) or abroad. In the case of Manitoba, the equivalent result is 0.6 per cent of all workers.
Taking the latest seasonally adjusted employment numbers from the July 2023 labour force survey gives us a ballpark estimate of the number of remote workers by home province vs interprovincial/abroad. We could expect about 114.4K remote workers to be working either interprovincially or abroad across Canada. For Manitoba, this process produces an estimate of 3.9 thousand people working fully remotely for employers located in other provinces or abroad.
Table 3: Estimated count of those fully remote by geography (thousands), Statistics Canada, CSBC, Q2-2023
| Description | Canada (thousands) | Manitoba (thousands) | Source |
|---|---|---|---|
| Employed as of July 2023 | 22,166.4 | 689.8 | 14-10-0287-01 |
| Estimated fully remote | 1,330.0 | 30.4 | |
| - in another province, or abroad | 114.4 | 3.9 | |
| - in the same province | 1,215.6 | 26.5 |
This compares reasonably well with earlier estimates in (Mehdi & Morissette, 2023), a recent review of Canadian data on the employment of remote workers in other provinces. [3]
As of Q4 2021, the estimated share of employees who telework was 20.73 per cent, using the estimate that 0.85% of all workers are interprovincial teleworkers, and that interprovincial teleworkers represent 4.1% of all teleworkers.
Table 4: Historical Estimates of teleworkers in Canada, Source: (Mehdi & Morissette, 2023)
| Description | 2001 Census | 2016 Census | 2021 CSBC: Q4-2021 Forecast |
|---|---|---|---|
| Employees who WFH as a share of all employees | 2.2 % | 3.1 % | 20.73 % |
| Employees who are interprovincial teleworkers | 0.05 % | 0.15 % | 0.85% |
| Estimated Interprovincial teleworkers | 3,500 | 12,600 | 112,700 |
| Estimate Non-interprovincial teleworkers | 155,591 | 249,900 | 2,636,080 |
| Estimated count of all teleworkers | 159,091 | 262,500 | 2,748,780 |
| Interprovincial teleworkers as a share of all teleworkers | 2.2 % | 4.8 % | 4.1 % |
| Non-Interprovincial teleworkers as a share of all teleworkers | 97.8 % | 95.2 % | 95.9 % |
End notes
[1] Their salary would be spent here on goods and services, so they would still be participating in the local economy.
[2] The data is saved in Statistics Canada’s Table 33-10-0685-01.
[3] This study does not delve into employers located outside of Canada. This presumably would increase the share of remote workers working for employers outside of Canada.
References
Barrero, J. M., Bloom, N., & Davis, S. J. (2021, April). Why working from home will stick. Retrieved from National Bureau of Economic Research Working Paper 28731: http://www.nber.org/papers/w28731
Mehdi, T., & Morissette, R. (2023, February 23). Working from home for an employer in another province or territory. Retrieved from Statistics Canada: https://www150.statcan.gc.ca/n1/pub/36-28-0001/2022002/article/00001-eng.htm